Trajectory Analysis
Analyse and visualise HYSPLIT trajectory files.
ggopenair-traj.Rmd
library(ggopenair)
library(ggplot2)
library(sf)
#> Linking to GEOS 3.10.2, GDAL 3.4.1, PROJ 8.2.1; sf_use_s2() is TRUE
Importing Data
Currently, trajectories should be imported using openair as this functionality hasn’t yet been ported to ggopenair.
# import trajectories
traj <- openair::importTraj(site = "london", year = 2010)

# import data for North Kensington
kc1 <- openair::importAURN("kc1", year = 2010)

kc1 <- dplyr::select(kc1, date, nox, no2, o3, pm2.5, pm10)

# now merge with trajectory data by 'date'
traj <- dplyr::left_join(traj, kc1, by = "date")

traj_red <-
  openair::selectByDate(
    traj,
    start = "15/4/2010",
    end = "21/4/2010"
  )
Path Plots
ggopenair exports traj_plot(), which is
extremely similar to trajPlot().
traj_plot(traj_red, colour = "pm2.5") +
  scale_opencolours_c() +
  theme_classic()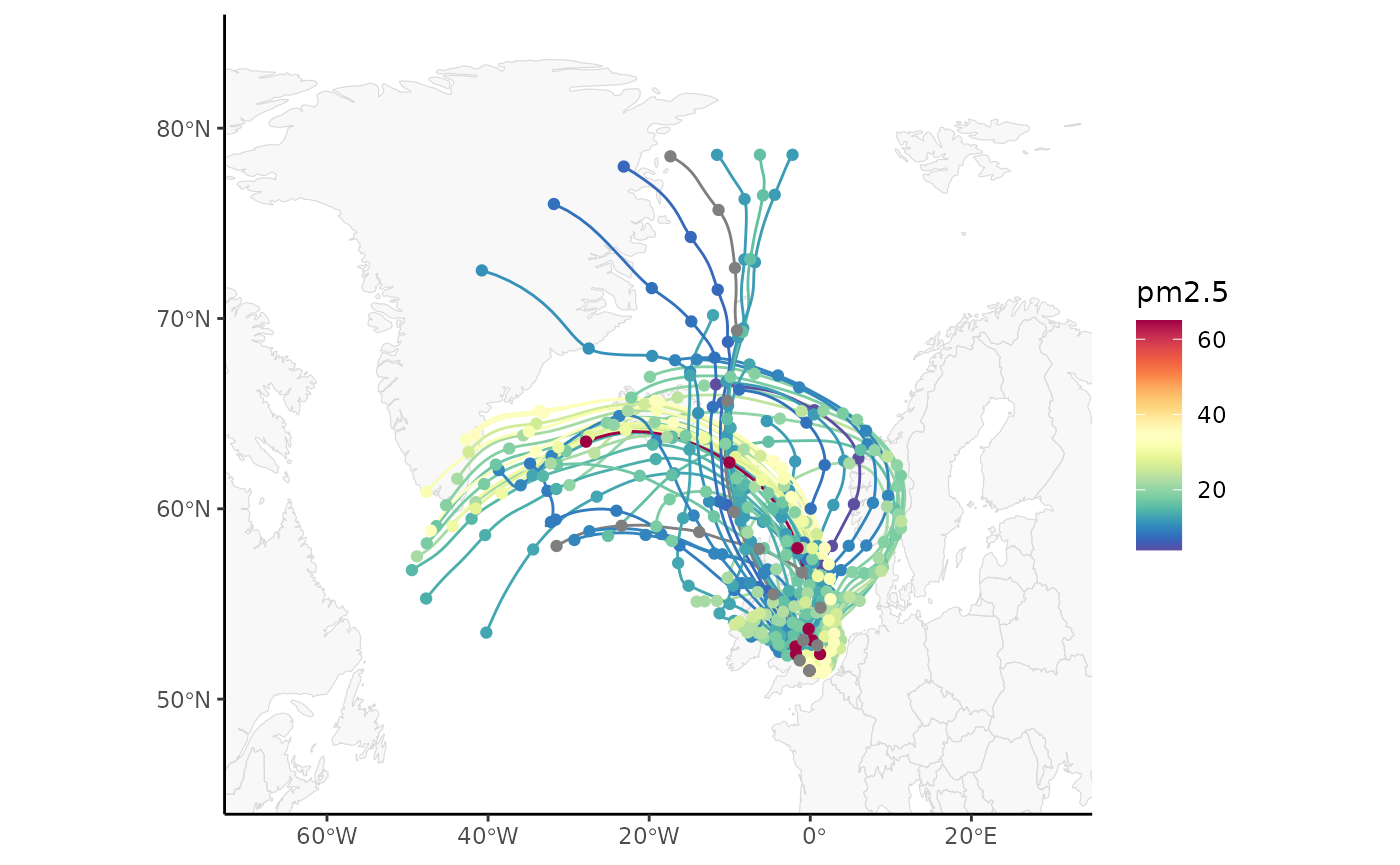
Binned Plots
traj_level() is also exported, which again behaves
almost identically to trajLevel(). All statistic types are
supported. Note that using scale transforms on the “fill” aesthetic is
almost always recommended.
traj_level(traj_red) +
  scale_opencolours_c(
    trans = "sqrt",
    label = scales::label_percent(scale = 1)
  ) +
  labs(fill = "% Trajectories\n(sqrt scale)\n") +
  theme_classic()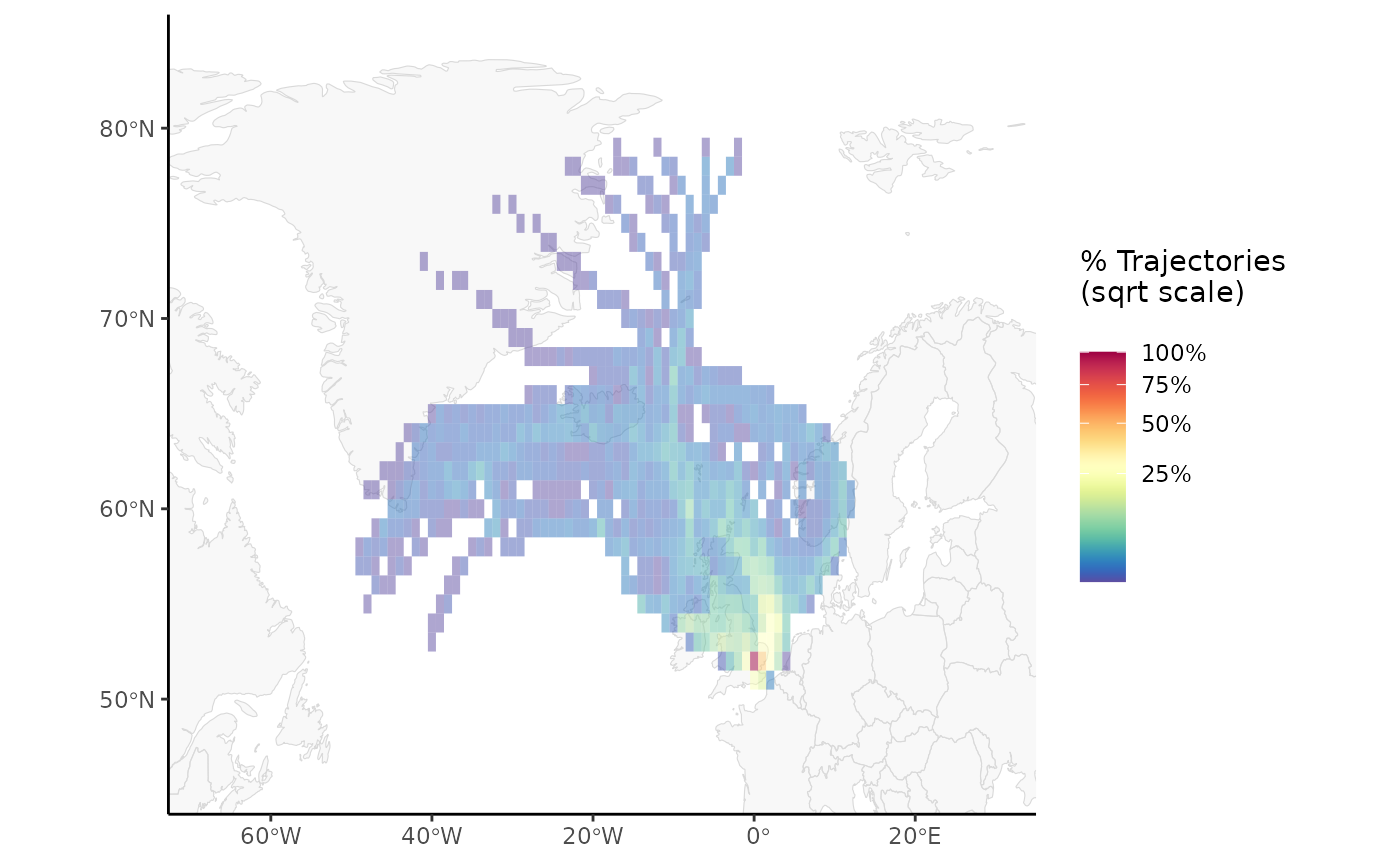
Traj Clustering
traj_cluster() also exists in ggopenair,
but is waiting on the next CRAN release of openair to be
fully functional.
–> –> –> –> –>