Dynamic Reporting
{quarto} and {rmarkdown}.
I have authored interactive documents for a wide range of projects and clients, from developing dynamic annual network summaries for the UK Government to efficiently writing up reports in response to unpredictable air pollution episodes.
Some examples of my work include:
Annual Reports (e.g., UK Hydrocarbons Network Annual Report)
Episode Reports (e.g., 2023 West London Particulate Episode Report)
Tools in which I am proficient that I use to develop these reports include:
{quarto}(and formerly{rmarkdown}) to render the documents.{plotly}and{ggiraph}for interactive plots and figures.{leaflet}for interactive maps.{ggplot2}and various extensions for static figures/maps.{gt}for interactive and static tables, and{DT}for interactive tables.mermaidfor flowcharts and other diagrams.
Screenshots from a dynamic report are shown in Figure 1.
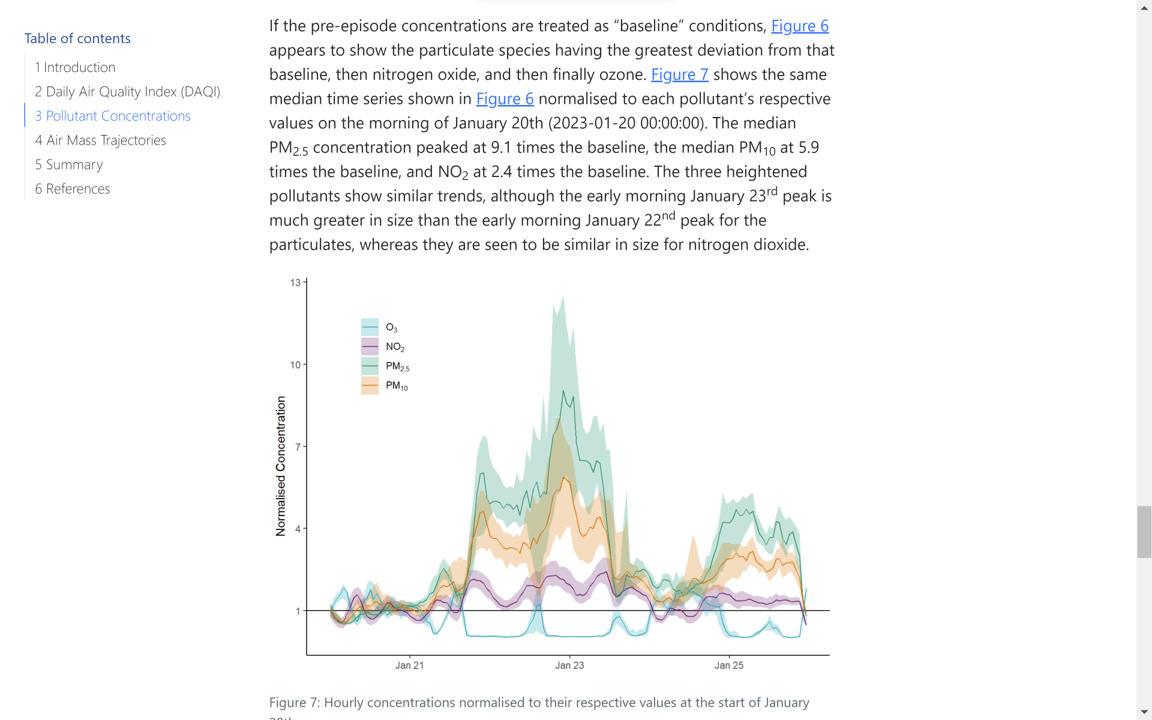
{ggplot2} figure.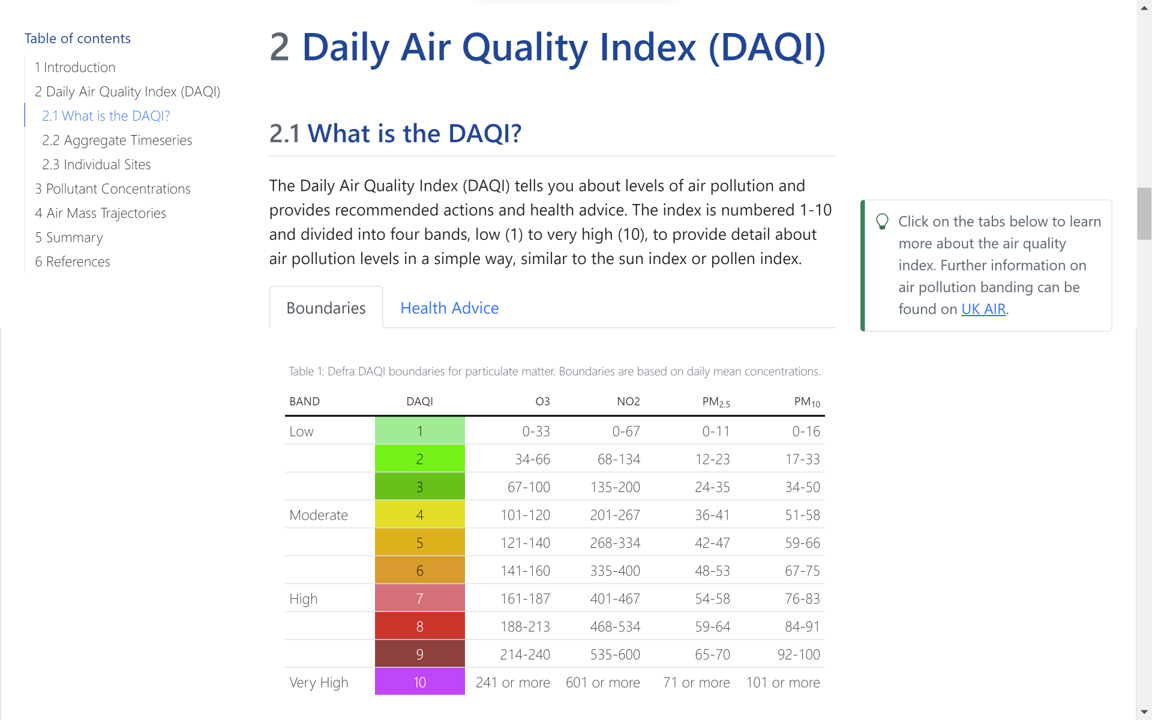
{gt} table.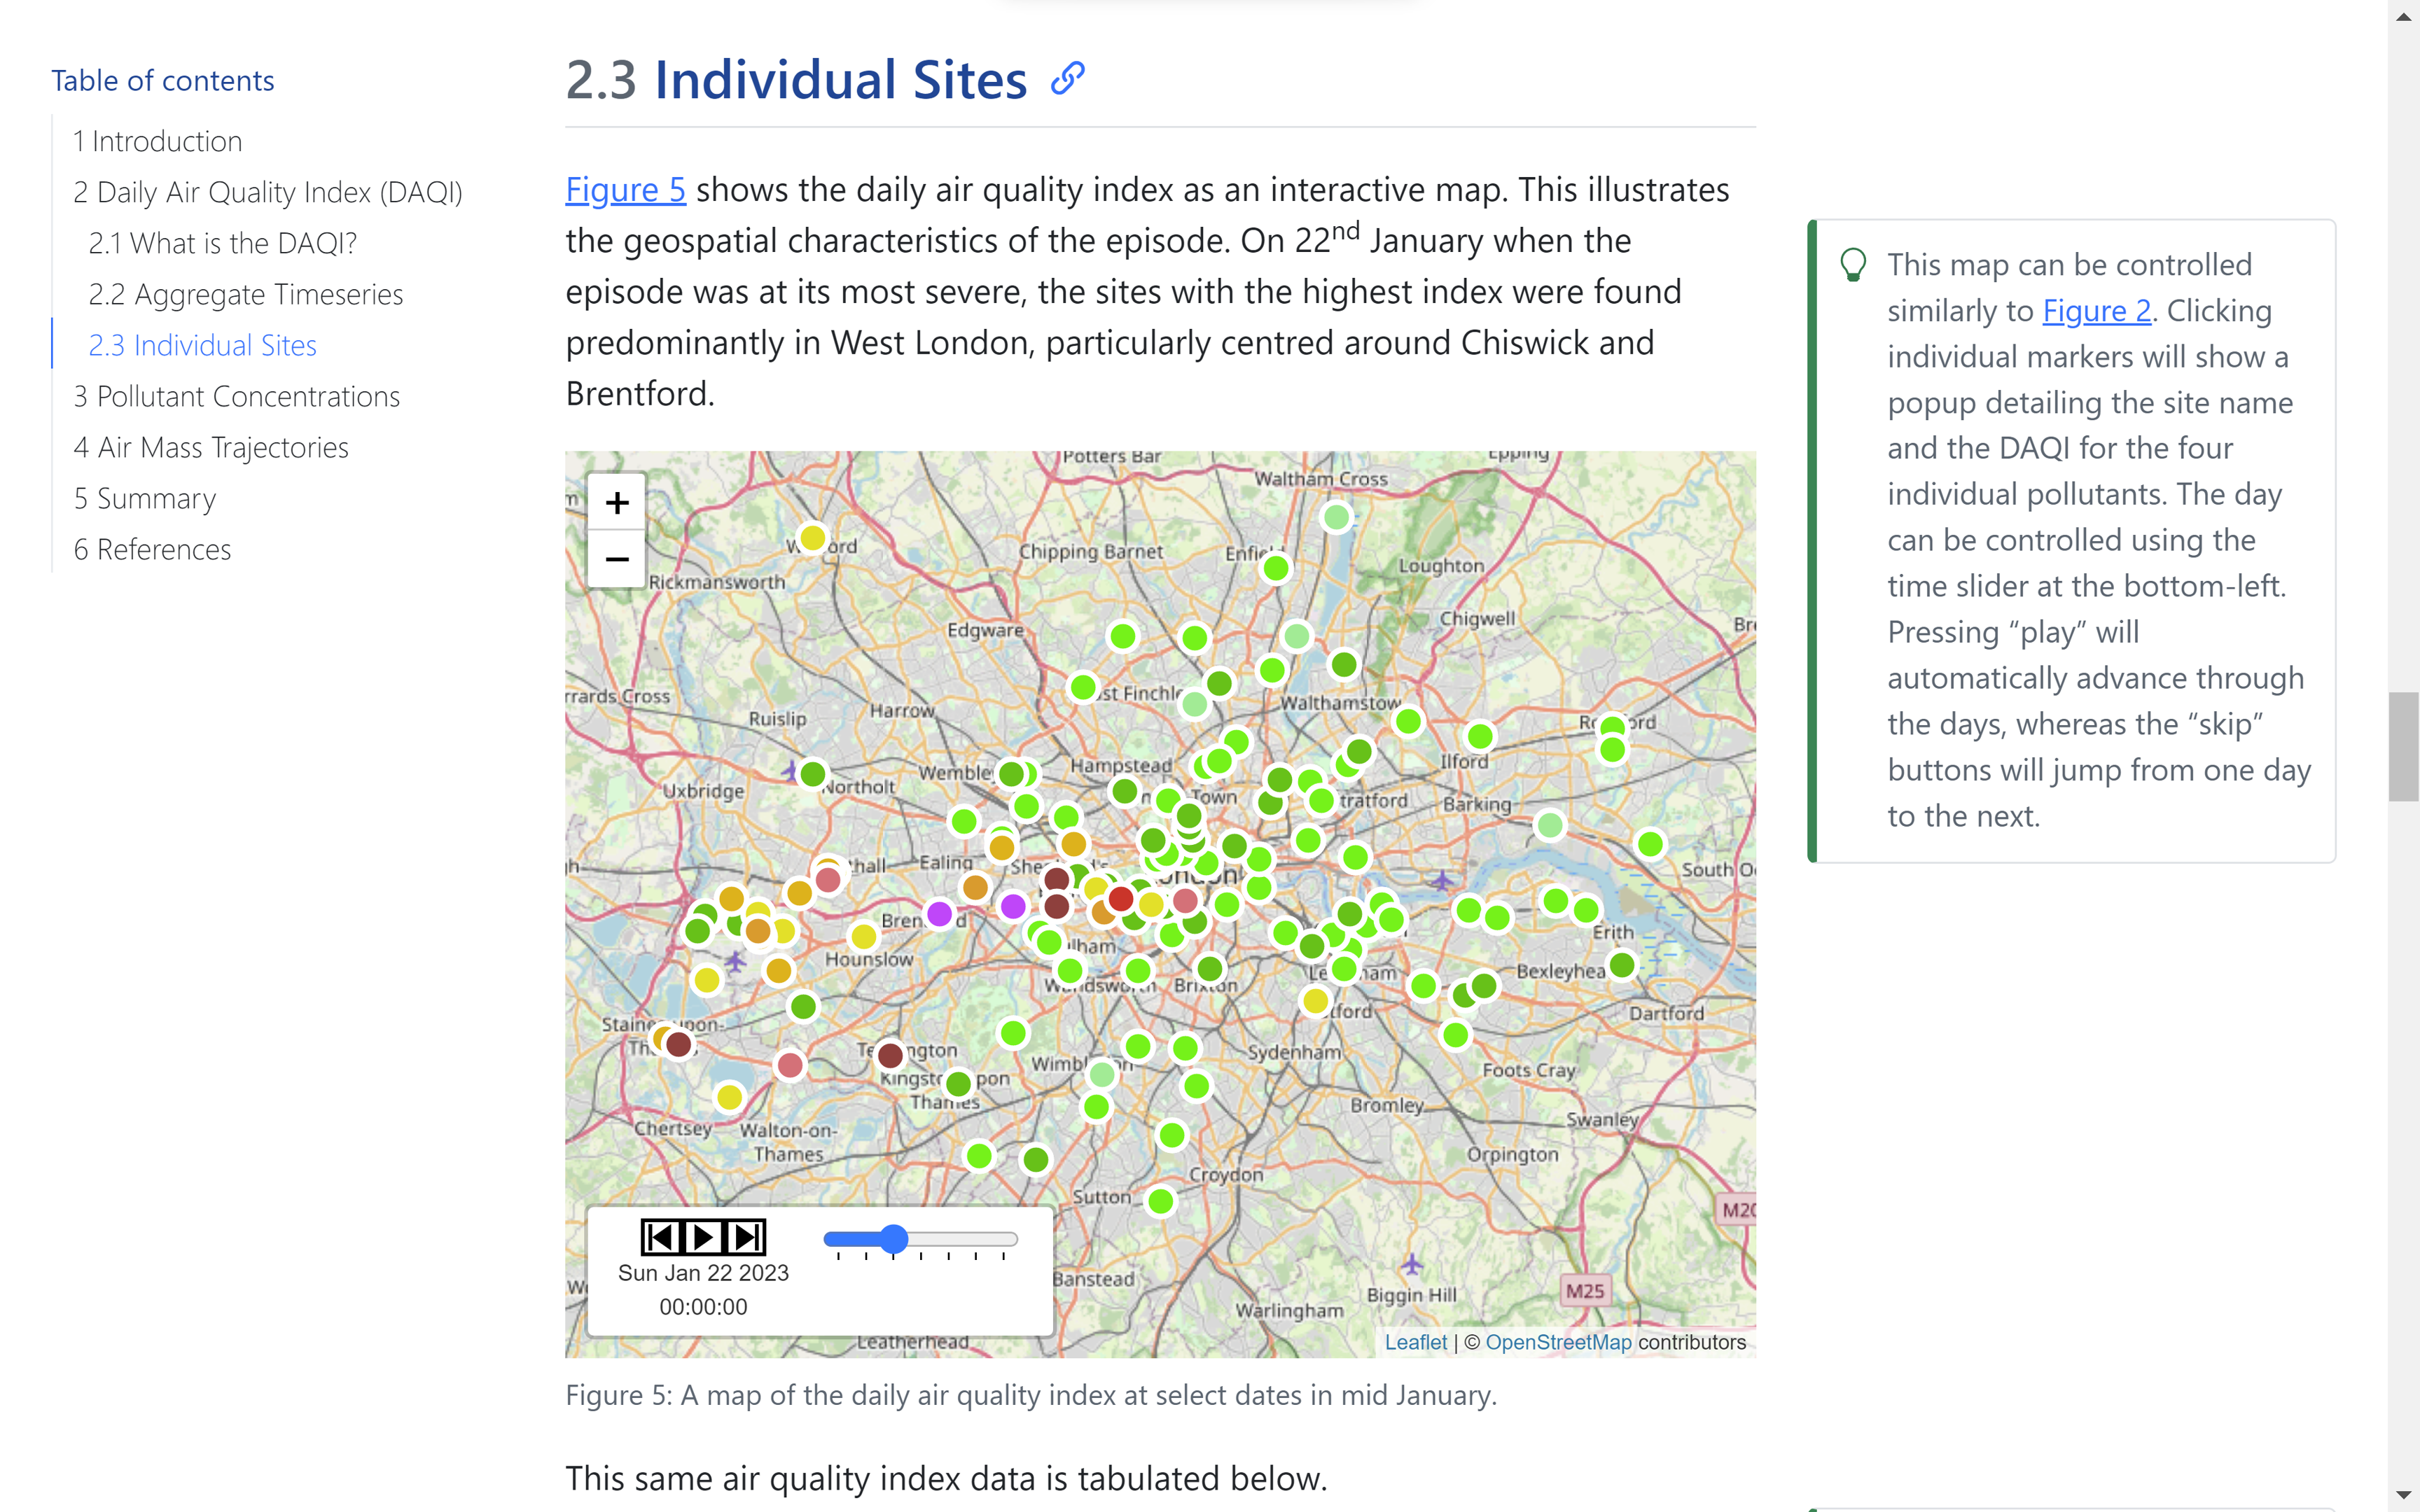
{leaflet} map using the {leaftime} extension.A collection of dynamic reports I have authored can be found in my portfolio.